|
||||||||
 |
||||||||
Acute Exposure |
||
Chronic Exposure |
||
CALENDAR |
||||||||||||||

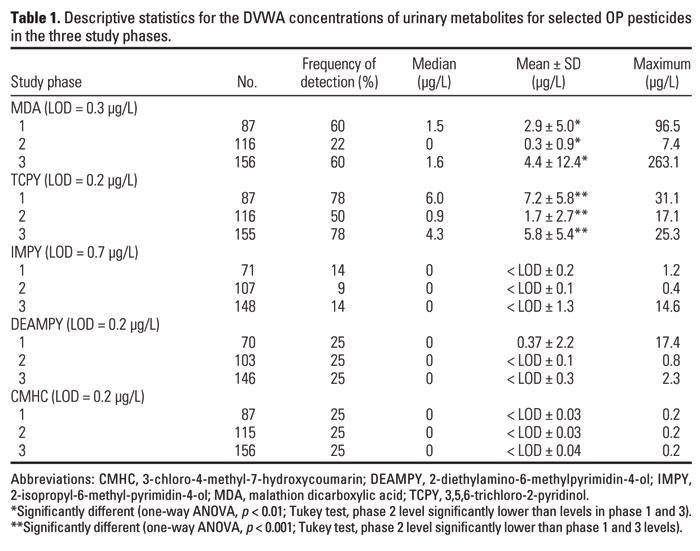
Measurement of urine metabolites of pesticides in urine; normal and abnormal levels of malathione and chlorpyrofos; excerpts from Environmental Health Perspectives, vol 114: 260-263, 2006.
Methods
Urine sample collection and analysis. For 15 consecutive days, parents collected urine samples from their child's first morning voids and the last voids before bedtime. Urine samples were collected daily, refrigerated or maintained on ice before processing in the lab, and then stored at -20°C until pesticide metabolite analysis was performed (Olsson et al. 2004) at the National Center for Environmental Health in the Centers for Disease Control and Prevention in Atlanta, Georgia. Metabolites for selected OP pesticides, pyrethroid insecticides, and herbicides in the urine samples were analyzed; the limits of detection (LODs) for the OP metabolites are listed in Table 1.
Data management. Concentrations of OP specific metabolites were reported as three categories, detectable (> LOD), detectable but not quantifiable (< LOD), and nondetectable (ND). For data analysis purposes, reported concentrations for samples with > LOD and < LOD were used, whereas zero was assigned for ND samples. The daily volume-weighted average (DVWA; micrograms per liter) of OP pesticide metabolites was calculated (Equation 1) by averaging the metabolite concentration in the morning sample with that of the previous day's bedtime sample and then normalizing for the total volume of these two urine samples:
DVWA = (Ci Vi)/(Vi), [1]
where Ci is the individual urinary concentration (micrograms per liter) and Vi is the volume of the correspondent spot urine sample (milliliters). In cases where only one of these two urine samples was collected, the metabolite concentration of the collected sample was used as the DVWA concentration. Urinary concentrations of OP metabolites were not adjusted by creatinine or specific gravity.
Results
Frequencies of detection (Table 1) for five OP metabolites in 724 urine samples collected from 23 children throughout the study period differed during the conventional diet phases (phases 1 and 3) and varied significantly between conventional and organic diet phases for two metabolites [malathion dicarboxylic acid (MDA), metabolite of malathion; 3,5,6-trichloro-2-pyridinol (TCPY), metabolite of chlorpyrifos]. These differences probably reflect the frequency of the uses of these OP pesticides in agricultural production, in which malathion and chlorpyrifos are all commonly used on fruits, vegetables, and wheat. para-Nitrophenol concentration was quantified but not included in this report because it is no longer considered a specific biomarker for methyl parathion exposure (Barr et al. 2002).